 TokenSave
How to Check Claude Code, Codex and Cursor Usage and Cost (2026)
Jonhisking · October 15, 2026
Claude Code shows you how close you are to your plan limit, but not where the tokens went. Inside a session, /usage gives you a percentage bar for the 5-hour window and the week, and on the API it gives you an estimated dollar figure for the current session. What it does not give you is a simple history: how much did last Tuesday cost, which project ate most of the month, and was the Max plan actually worth it compared with paying per token?
That information is already on your computer. Claude Code writes every conversation to a log file, and each reply in that file records the model and the exact token counts. Command-line tools such as ccusage and CodeBurn read those files and add them up. I wanted the same answer without installing anything, so I built a Claude Code usage analyzer that reads the logs inside the browser. It also reads Codex logs and Cursor's usage export.
This post explains where the usage data lives, the ways to check it, and what I found when I ran my own logs through the analyzer. Every number below comes from those logs and from the official price lists, checked on October 15, 2026.
Where Claude Code stores your usage
Claude Code keeps a transcript of every session under ~/.claude/projects/. Each project gets its own folder, and each session is a .jsonl file: one JSON object per line. Subagent conversations sit in a subagents/ folder next to the session they belong to.
| OS | Folder |
|---|---|
| Windows | %USERPROFILE%\.claude\projects |
| macOS | ~/.claude/projects |
| Linux | ~/.claude/projects (or projects/ inside CLAUDE_CONFIG_DIR if you set it) |
Every reply from the model has a usage block with five numbers that matter for cost:
- input tokens: new input that was not cached
- cache creation tokens: input written to the prompt cache, split into 5-minute and 1-hour writes
- cache read tokens: input served from the cache
- output tokens: what the model wrote, including thinking
- model: for example
claude-opus-5-5
Two details trip people up. First, the same reply is often written on several lines while it streams, and it can be copied again when you resume a session, so a naive sum counts it more than once. The analyzer keeps one copy per message ID and request ID. Second, the files do not live forever. According to the Claude Code documentation, it deletes transcripts older than cleanupPeriodDays, and the default is 30 days. If you want a longer history, raise that value in ~/.claude/settings.json before the old files disappear.
Four ways to check Claude Code usage
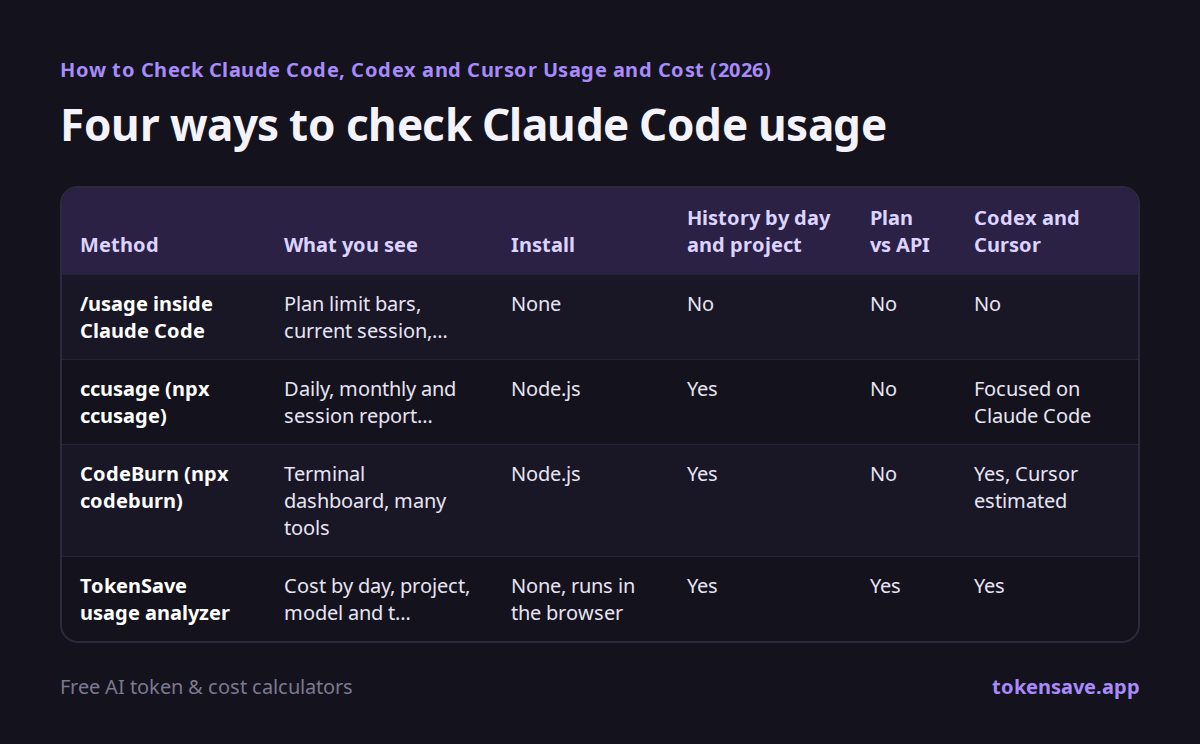
| Method | What you see | Install | History by day and project | Plan vs API | Codex and Cursor |
|---|---|---|---|---|---|
/usage inside Claude Code |
Plan limit bars, current session, what counts against the limit | None | No | No | No |
ccusage (npx ccusage) |
Daily, monthly and session reports in the terminal | Node.js | Yes | No | Focused on Claude Code |
CodeBurn (npx codeburn) |
Terminal dashboard, many tools | Node.js | Yes | No | Yes, Cursor estimated |
| TokenSave usage analyzer | Cost by day, project, model and tool, CSV | None, runs in the browser | Yes | Yes | Yes |
/usage is the right place to check whether you are about to hit a limit. On Pro and Max it also shows what is eating that limit, such as subagents, MCP servers or cache misses. It is not built for looking back over weeks. ccusage and CodeBurn are good if you already live in the terminal; both read the same .jsonl files. The browser analyzer is for people who would rather not install Node.js, or who want the plan-versus-API comparison on one screen.
How to use the analyzer
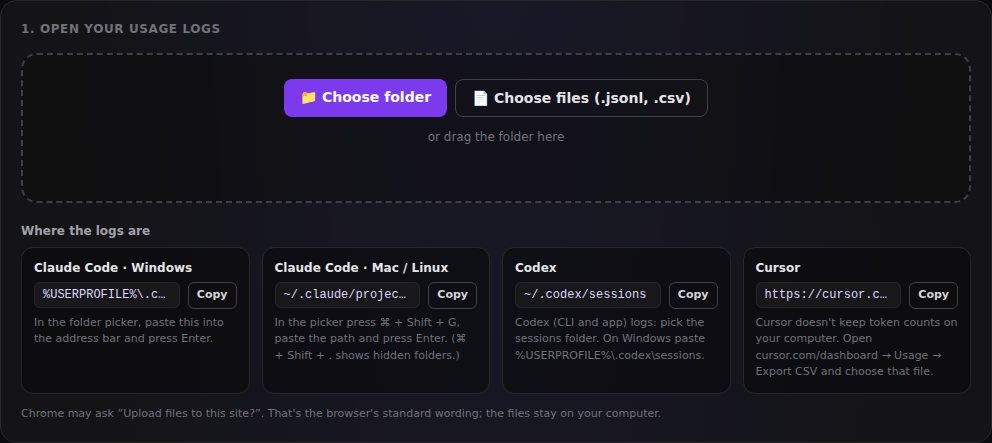
- Open tokensave.app/claude-code-usage.
- Click Choose folder and pick your
projectsfolder. On Windows, paste%USERPROFILE%\.claude\projectsinto the address bar of the folder picker. On a Mac, press ⌘ + Shift + G and paste~/.claude/projects. - Optional: add
~/.codex/sessionsfor Codex, and a Cursor usage CSV (Cursor dashboard → Usage → Export CSV). - Read the results. Switch the period between all, 7 days, 30 days and this month, and pick your plan to compare.
A few notes on reading the screen. "Replies" counts model responses after duplicates are removed, not your prompts; one prompt to an agent usually produces many replies, because each tool call and each step is a separate response. "Tokens" adds input, output and both kinds of cache traffic, so it will look enormous next to the size of your actual conversation. The project names come from the working folder recorded in each log, which is why the same repository can appear twice if you opened it from two different paths. If a model has no known price yet, the analyzer lists it under the tables instead of guessing, and the Download CSV button gives you one row per day with every token type and the cost, ready for a spreadsheet.
Chrome may ask "Upload files to this site?" when you pick a folder. That is the browser's fixed wording for folder access. The page reads the files with the browser's File API and only adds up numbers; your prompts and code never leave the tab, and nothing is sent to a server.
What my own logs showed
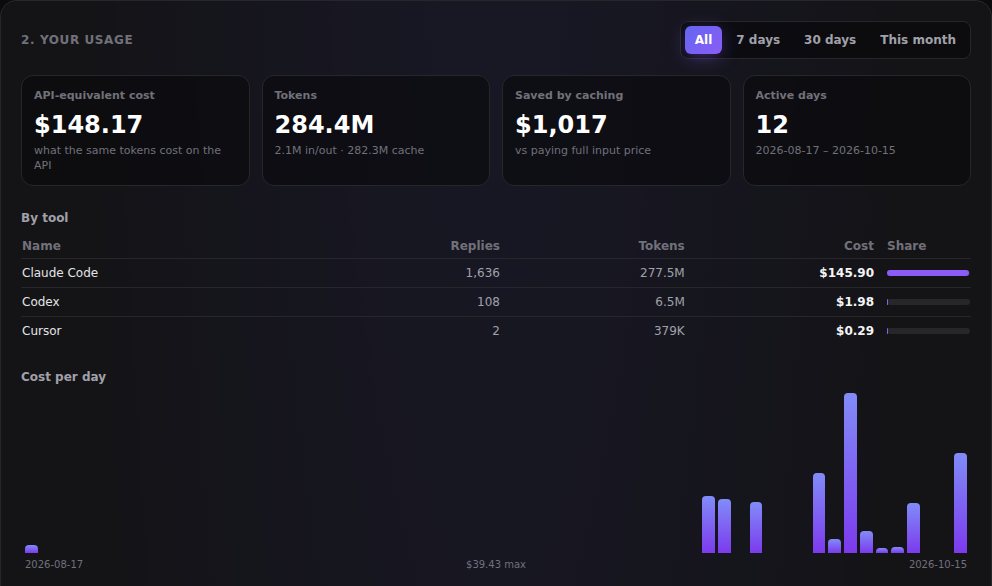
I loaded three sets of logs: the Claude agent sessions I used to build and maintain this site (they are written in the same Claude Code format), the Codex sessions on my PC, and the Cursor usage CSV from my account.
| Tool | Replies | Tokens | API-equivalent cost | Plan I was on |
|---|---|---|---|---|
| Claude Code (Opus 5.5) | 1,636 | 277.5M | $145.90 | Max 5× |
| Codex (GPT-5.6 Terra, GPT-6 Luna) | 108 | 6.5M | $1.98 | Free |
| Cursor (Grok 4.6) | 2 | 379K | $0.29 | Free |
The Claude Code part covers 10 active days between September 29 and October 15. The busiest day, October 8, came to about $39 at API prices.
The token split was the real surprise. Of 277.5 million tokens, only about 3,000 were fresh input. Around 264 million were cache reads, about 10.8 million were cache writes and 1.8 million were output. In other words, more than 95% of what Claude Code "used" was the same context being read again from the cache. That is how an agent works: on every step it re-sends the conversation, the files it opened and the tool results, and the cache makes that cheap.
Cheap is not free, though. Here is where the $145.90 went, priced at Opus 5.5 rates:
| Part | Price per 1M tokens | Share of cost |
|---|---|---|
| Cache reads | $0.20 | about 36% |
| 5-minute cache writes | $5.00 | about 34% |
| Output | $20.00 | about 25% |
| 1-hour cache writes | $8.00 | about 4% |
| Fresh input | $4.00 | under 1% |
Cache reads are 95% cheaper than normal input on Opus 5.5, but there are so many of them that they still made up the largest share. Cache writes were almost as large, because every new file, tool result or long answer has to be written into the cache before it can be read cheaply. Output was only 1.8 million tokens, yet a quarter of the bill, because output costs $20 per million.
Without the cache, the same cache reads would have cost about $1,017 more at the plain input price. That is the "Saved by caching" figure in the screenshot.
Is Claude Max worth it? Plan vs API

The analyzer compares the plan you pick with the API cost of the same tool over the same period. My Claude logs span 17 days. Max 5× is $100 a month before VAT, so 17 days of it is about $56.67. The same tokens on the API would have cost $145.90, which means I used about 257% of the fee in API value. For heavy agent work, the subscription was clearly cheaper than paying per token.
Two cautions when you read your own result:
- Plans have limits. Pro and Max reset every 5 hours and also have a weekly cap. If your API-equivalent figure is many times the fee, you are probably hitting those limits, and the real choice is between waiting, upgrading or paying for extra usage.
- Light users can lose money on a plan. My Codex and Cursor usage was on free plans and came to $1.98 and $0.29. If I had paid for ChatGPT Plus ($20 a month) for that Codex usage, the plan would have been worth less than the fee. The analyzer shows this case in amber.
If you have never used Claude Code and want a forecast rather than a history, the Claude Code cost calculator estimates a month from task size and tasks per day.
Codex and Cursor usage
Codex keeps its logs in ~/.codex/sessions/YYYY/MM/DD/, one rollout-….jsonl file per session. Instead of one usage block per reply, it writes a running total for the whole session at each step. The analyzer takes the difference between steps and prices it at OpenAI's API rates, with cached input at the cached rate. In my files, GPT-5.6 Terra costs $2 per million input tokens, $0.20 cached and $12 output; GPT-6 Luna costs $0.10, $0.01 and $0.50. Archived sessions are moved to archived_sessions/ with the same name, so the analyzer counts a file name only once.
Cursor is different. I opened Cursor's local database on my PC, and every conversation had its token count stored as zero. Current builds simply do not keep token counts locally, which is why command-line tools can only estimate Cursor usage from text length. The accurate source is the usage export on the Cursor dashboard: go to Usage and click Export CSV. Each row has the date, model, input with and without cache writes, cache reads, output and the cost Cursor charged. The analyzer uses that cost as it is.
How to bring the number down
Knowing that most of the cost is cache traffic and output points to a few habits:
- Start fresh sessions for new tasks.
/cleardrops the old context, so the next steps stop re-reading it. Long sessions keep paying cache reads on everything that came before. - Use Sonnet for routine work. Sonnet 5.5 is $2/$10 per million against Opus 5.5's $4/$20, so the same session costs about 50% less at API prices.
- Watch the expensive days. The daily chart makes it easy to see which day, and so which kind of task, pushed the cost up.
- Trim tools you do not use. On a plan,
/usageshows which MCP servers and subagents take a share of your limit.
There are more ideas in ways to save tokens in Claude Code, and the limits themselves are covered in Claude Code usage limits.
FAQ
How do I see my Claude Code usage history?
Open your ~/.claude/projects folder with the usage analyzer, or run npx ccusage in a terminal. /usage inside Claude Code shows the current limits, not a history.
Does the analyzer upload my code? No. It reads the files in your browser tab and only sums the token numbers. Nothing is sent anywhere.
Why is my API-equivalent cost so much higher than my plan? Agents re-read the whole context on every step, which creates huge cache traffic. On a plan you pay a flat fee, so the API-equivalent figure is what the same tokens would cost if you paid per token.
Why does it only show the last month?
Claude Code deletes transcripts older than 30 days by default. Raise cleanupPeriodDays in settings.json to keep more.
Can it read Gemini CLI, Copilot or Windsurf? Not yet. It reads Claude Code, Codex and the Cursor CSV today.
Summary
Claude Code already records every token you use; the hard part is reading it. /usage tells you how close you are to the limit, while the logs in ~/.claude/projects tell you where the money went. In my own 17 days of agent work, almost all tokens were cache reads, cache traffic made up about three quarters of the API-equivalent cost, and Max 5× returned about 257% of its fee. Codex and Cursor on free plans came to a couple of dollars. If you want to see your own numbers, load your folder into the usage analyzer and compare the result with your plan.
Sources
- Claude Code docs: Explore the .claude directory (transcripts and the 30-day cleanup)
- Claude Code docs: Manage costs effectively (/usage)
- Anthropic API pricing (prompt caching rates)
- OpenAI API pricing
- Claude plans · Cursor pricing
- ccusage · CodeBurn
More articles
- Nano Banana Pricing & Free Limits (2026)
- ChatGPT Usage Limits 2026: Every Plan and the 5-Hour Window
- Indie Game Development Cost: Solo Dev Budget, Fees, Real $20 Case
- Grok API Pricing 2026: Grok 4.7, 4.3, Tools and Imagine Costs
- DeepSeek API Pricing 2026: Official Rates, Peak Hours, API Key
Open your ~/.claude/projects folder and see your own cost by day, project and model. Nothing is uploaded.
Open the usage analyzer →